
Video Insight Analyzer
In our previous blog post, we explored the brilliance of Signified B Sides' commentary on aging in hip-hop. The post dissected generational dynamics, commercialism, and the genre’s evolution all through the video Hip Hop Has an Age Problem... Kinda
But behind the scenes of that editorial was a powerful data pipeline. Something we now call the Video Insight Analyzer or Cultural Lens.
This follow-up post is for our data-lovers, product thinkers, creative engineers, and anyone curious about how culture-tech products like ours get built. Below, we walk through the scaffolding: the definitions, the pipelines, the charts, and the frameworks that guided us toward culturally grounded, insight-rich storytelling.
Step 1: Choosing a Cultural Moment Worth Dissecting
We began with a question:
How can we detect meaningful cultural signals from a single YouTube video and turn them into structured, insight-driven content?
The pilot source:
Hip Hop Has an Age Problem... Kinda by Signified B Sides
Why this video? It wove together:
Cultural history
Strategic critique
First-person vulnerability
Perspective-shifting commentary
It was the perfect testbed for analysis; one foot in data, one foot in culture.
Step 2: Building the Gumloop Flow
Our pipeline was built in Gumloop, an AI automation platform. This allowed us to go from raw YouTube transcript to JSON-extracted data and eventually a fully structured spreadsheet.
The backbone of the workflow looked like this:
| Node Order | Gumloop Node Name | Function |
|---|---|---|
| 1 | Get YouTube Transcript |
Pull transcript from YouTube |
| 2 | Ask AI |
Use a custom prompt to extract culturally significant claims |
| 3 | JSON Extractor 2 |
Clean and retain structured fields (timestamps, type, etc.) |
| 4–7 | Wrappers + Parsers |
Parse and flatten the JSON |
| 8 | Run Code |
Align and structure all lists by index |
| 9 | Extract to Table |
Output to Google Sheets |
You can explore the full prompt and detailed flow in the Gumloop | Stop the Cap Documentation (PDF), or scroll through the Gumloop Node gallery below to see a snapshot of each node in the workflow presented in sequence with their corresponding inputs and outputs.
In essence, what follows is the Visual Insight Analyzer | Cultural Lens we developed, and this blog post walks you through how it came to life.
Gumloop Node Gallery


Step 3: Defining the Cultural Lens
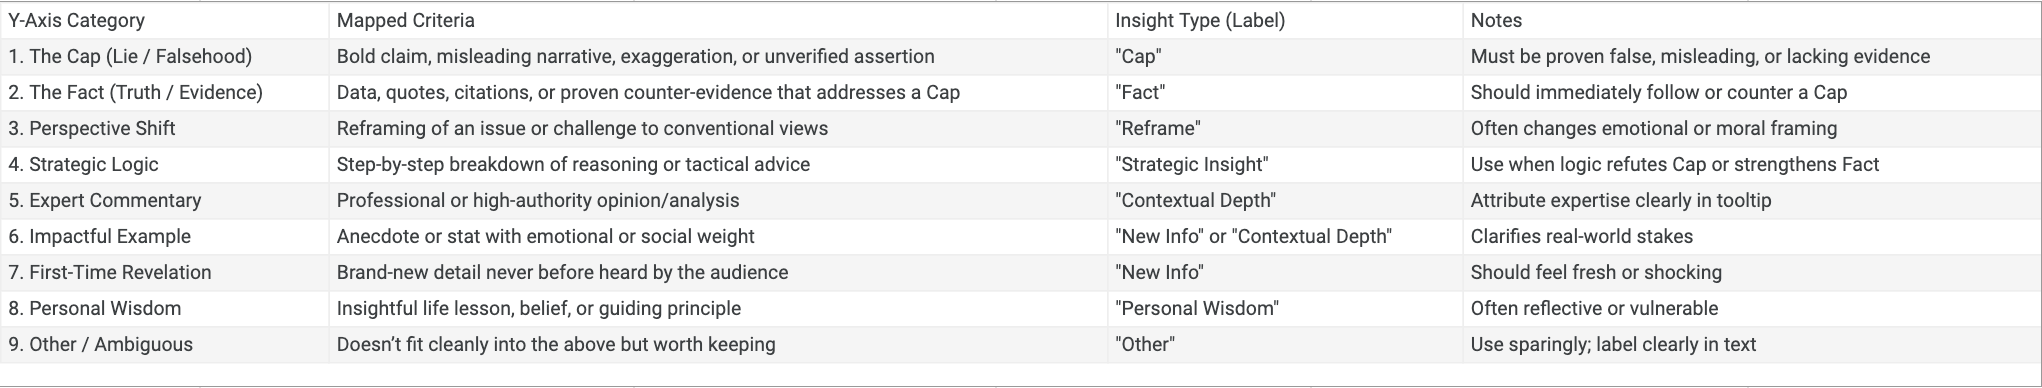
The type field, which later became our y-axis, wasn’t just randomly selected. It was based on a manually crafted Cultural Insight Typology, designed to cover the most valuable types of spoken insights in creative or intellectual videos.
We called this the Cultural Lens:
| Order | Y-Axis Category (Type) | Description |
|---|---|---|
| 1 | Cap | Misleading or false claims |
| 2 | Fact | Verifiable truth |
| 3 | Reframe | Perspective shift |
| 4 | Strategic Insight | Logical tactics, big-picture logic |
| 5 | Contextual Depth | Expert or analytical observations |
| 6 | New Info | First-time revelations or data |
| 7 | Impactful Example | Anecdotes or concrete storytelling |
| 8 | First-Time Revelation | Cultural rarity or unvoiced truth |
| 9 | Personal Wisdom | Vulnerable, principle-driven insights |
| 10 | Other | Anything that defies easy classification |
Step 4: Final Output Table
(Breakdown Format)
From the JSON extractor, we created a table (logged in Sheets, then exported as a PDF) that looked like this: Output of Mapped Cultural Lens by Timestamp of the Video (more on this later).
Each row contained:
start_timestamp / end_timestamp
category (e.g., Culture, Politics, Finance)
type (Cultural Lens tag)
summary
text (verbatim quote from transcript)
claim/fact
project (always “Stop the Cap”)
type_order (numerical representation of
type)
Think of it like a music sheet, every “note” is an insight, properly scored by type and time. The resulting output is a table of the type mapped to the insights of the video with timestamps (so the Cultural Team can go back and review).
Step 5: Visualizing the Insights
(Data as Narrative)
Once we had a rich spreadsheet of insights, we created three visualization artifacts that powered our blog analysis and also made for easy cultural interpretation.
Chart 1: Insight Table by Timestamp
Type: Data Table
What It Shows: Chronological list of insights from video
Why It Matters: Lets you see how the narrative unfolds; fact, followed by personal wisdom, followed by reframe, etc.
Chronological timeline of extracted insights from Signified B Sides’ video.
Chart 2: Insight Type Trendline
Type: Line Chart
X-axis:
start_timestampY-axis:
type_order(from the Cultural Lens)
What It Shows: Movement of insight types as the video progresses
Why It Matters: Think of this like a mood tracker. Are we in strategy, vulnerability, or truth-telling mode?
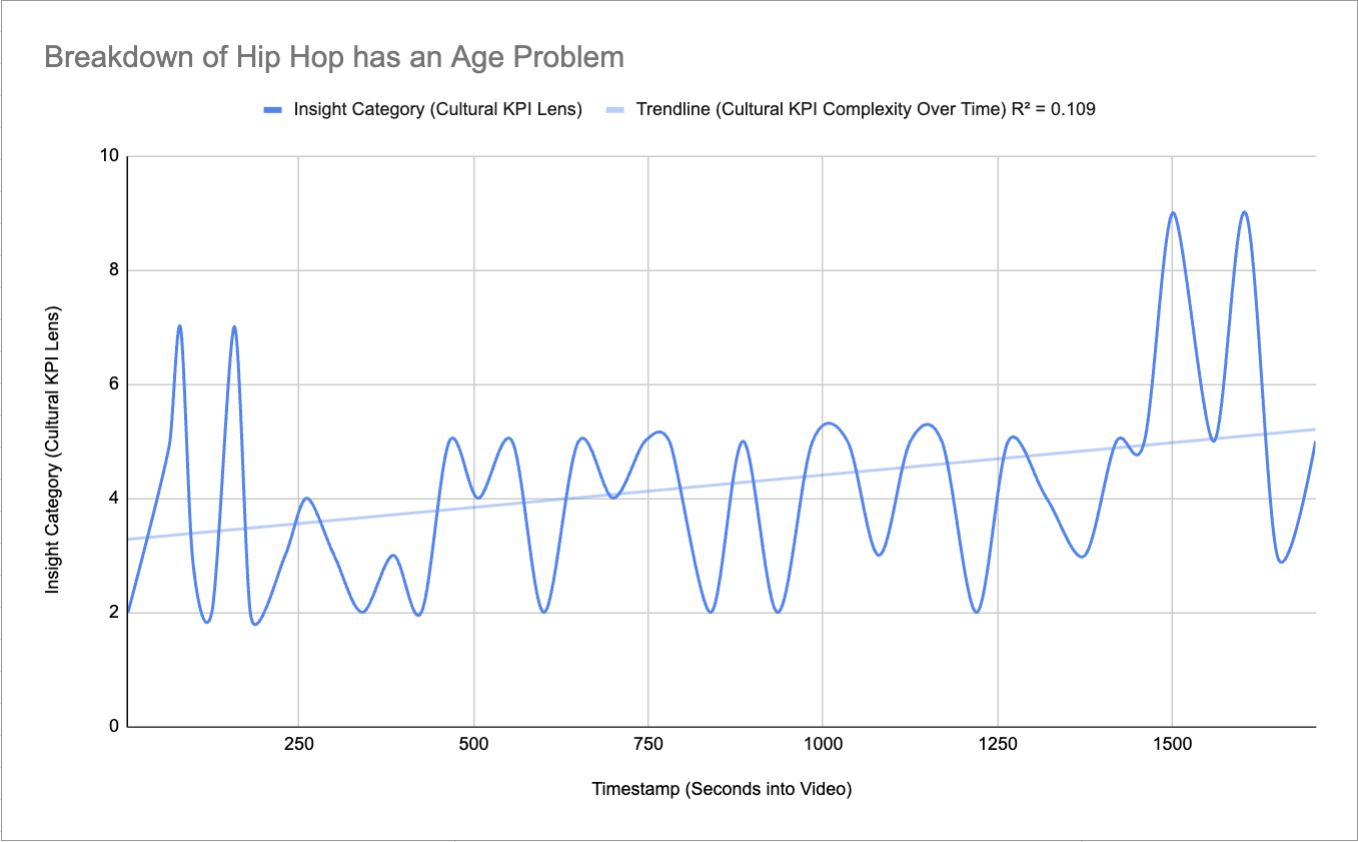
Thematic evolution of insights throughout the video, revealing tone and logic shifts.
Chart 3: Duration vs. Type
Type: Line Chart
X-axis:
start_timestampY-axis: Duration (calculated:
end_timestamp - start_timestamp)
What It Shows: How much narrative space is given to each insight
Why It Matters: If you linger on a "Cap" claim, it’s probably a big one. If you move fast through facts, maybe they’re side notes.

The visual duration of each insight helps highlight what the creator chose to emphasize, and what needed debunking or praise.
This Duration vs Time graph above is used in conjunction with the Output of Mapped Cultural Lens by Timestamp of the Video for the team to do deeper analysis on this front. See the snapshot of this table below:

Snapshot of the mapped Cultural Lens by Timestamp of the Video with an emphasis on the start and end time for each insight shared within the content creators video.
Key Takeaways & Cultural Decisions
Throughout this project, we made deliberate, culturally rooted decisions. Here are some of the most important:
Timestamp Integrity: We re-engineered the JSON extractor multiple times to ensure second-level granularity.
If you’re measuring culture, tempo matters.Y-Axis Logic: The Cultural Lens isn’t about academic hierarchy. It’s about emotional, strategic, and truth-based relevance.
We wanted creators and strategists alike to find use in the typology.Visual Narratives: By keeping visuals minimal (and exportable), we opened up new formats: decks, PDFs, blogs, and social assets.
Opportunity: Analyze the insights that the content creators are presenting.Cap Detection Meets Cultural Analysis: We didn’t want a “gotcha” engine. We wanted to treat culture fairly, recognizing truth, highlighting wisdom, and respectfully labeling exaggeration.
Opportunity: Culture requires participation, so this is our contribution to continue these types of conversations within the culture.
Bridging Product and Culture
In the end, what started as a content idea evolved into a reusable product. The Video Insight Analyzer | Cultural Lens now works with:
Educational videos
Cultural essays
Commentary breakdowns
Interview analysis
...and we’re only getting started.
See how the full workflow was defined in the Gumloop | Stop the Cap Documentation (PDF) so you can rebuild and remix on your end. Or let us know what video you want analyzed.
(Note: Internally, this project was called ‘Stop the Cap’. All tech projects have weird names, right 😅)
Rewatch the featured video Hip Hop Has an Age Problem... Kinda by Signified B Sides, with this in mind, and let us know what you think. Is it helpful, or is it not?
References
| Reference | Type | Use |
|---|---|---|
| Video: Signified B Sides | Source | Inspiration and data source for analysis |
| Blog v1 | Post | Link to first blog |
| Breakdown PDF | Output Table | Timestamped insight reference |
| Gumloop Flow PDF | Workflow Map | Node-by-node logic overview |
| Insight Table PNG | Visual Schema | Cultural Lens categories for tagging |
Final Words
At ProKPI Brokers, we believe culture deserves both celebration and scrutiny. The Creative Culture Team is our bridge, from creator to insight to tech solutions; from clips to charts.
This post is just the start. If you’re a creator, critic, or strategist, and you want your work analyzed with cultural intelligence, integrity, and data, get in touch.
In culture and KPIs,
The Creative Culture Team
www.prokpibrokers.com